
Table Annotation
Capture data from tables (Instructions)
To start drawing a Table:
- Draw a box over the table area on your image.
- On the label popup > Click on the toggle at the top to Switch to Table mode
- You can leave the number of rows and columns as 1 x 1, and click on Add Table.
This will add a single cell to your image. To edit this,
- Click on "Show Grids" at the bottom bar of your image.
- Click on the blue outline of the Table to start editing the grid.
- Hover at the point on the grid where you want to add a separator.
- You will see a blue circle at the edge of the line. Click at that point to add the column or row line.
- Once you have added the column and row lines where you need them, click on Extract data as table.
- You will see label bounding boxes added for each cell on your image.
- Follow the steps below to edit table data.
Alternatively, you can type in the number of rows and columns while adding the table and then adjust the column and row lines by dragging them.
Edit table data
Once you've captured the data from the grid, you can edit the boxes such that you extract only the data you need. For example: Your product column contains Product_code and Product_description but you only need to extract Product_code.
Edit data using the boxes on the image:
- On the image > click on the box for the cell data you want to edit.
- Drag to Resize the box so that it contains only the data you need.
- You will see the data reflect on the panel to the right.
Or,
Edit data from the cells on the panel to the right:
- On the panel to the right > Click on the cell you want to edit.
- Type to edit the text or select the text and hit delete to clear.
Please note: The bounding box on the image will not auto-resize to match the data you manually edit.
Assign Column name labels to table data
Note:
You do not ned to assign the same label name as the text for that column on your image. For example: If your image has a column "Product code" but your database uses "Item ID", you can label the extracted column Item ID. Nanonets export will show the column name you add.
To assign column names or headers to the extracted data, follow the steps to assign a label from the panel to the right.
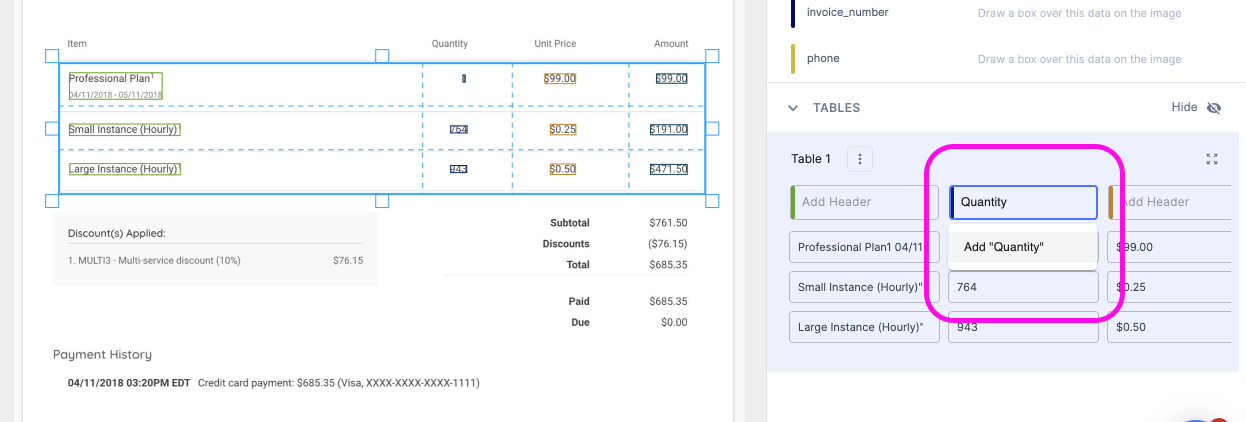
- Find the column you need to label.
- On the top of each column you will see a dropdown and input field (Header)
- Type the column name you want to create.
- Click on Add <your column name>
- All the cells below that header will be assigned to that column label.
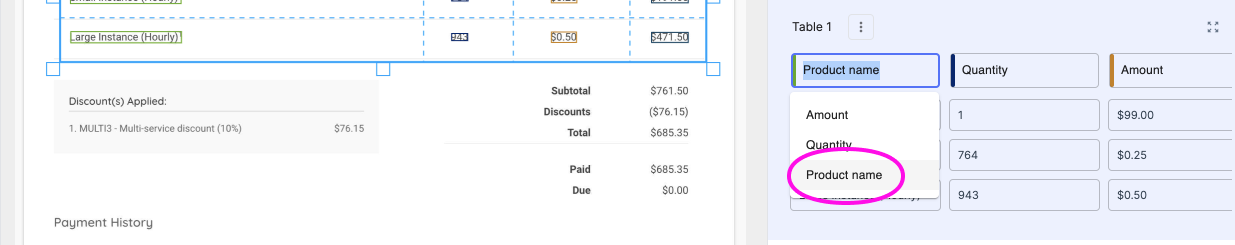
Once you have added the column names you need, you can simply select from the name dropdown on the other images.
Important:
When training a custom model with Tables, you need to add at least 10 examples for each column name you add. For example: If you have added the column label "Quantity" on one image, you will need to mark 10 other columns on any other images with the name "Quantity".
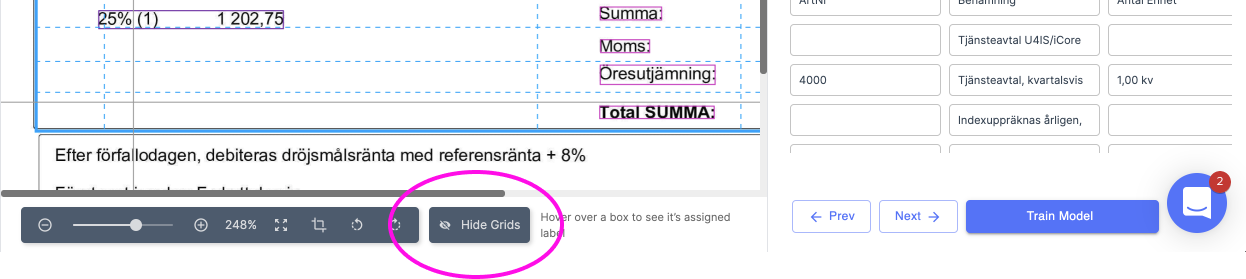
How do I hide the gridlines on the image?
On the bottom bar under the image > click on Hide grids.
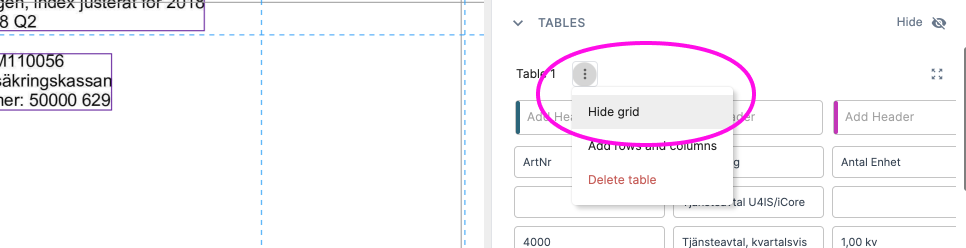
Or, to hide a grid for a particular table only:
- Click on the dropdown icon next to a Table name on the panel to the right
- Select Hide grid. (This will hide the grid only for the Table you selected)
Keyboard Shortcuts Guide
Enhance your efficiency in Nanonets by navigating and editing tables using keyboard shortcuts, just like in Excel.
Features and Limitations
-
Supported Actions:
- Navigate using arrow keys.
- Copy, paste, and delete the contents of a cell.
- Select multiple cells and paste a value into them.
-
Limitations:
- Copying values from multiple cells is not supported. Only the value in the topmost cell is copied when multiple cells are selected.
Quick Reference Guide
Navigation Shortcuts
| Shortcut | Action |
|---|---|
| Right Arrow | Move to the next cell in the same row. |
| Left Arrow | Move to the previous cell in the same row. |
| Up Arrow | Move to the cell above in the same column. |
| Down Arrow | Move to the cell below in the same column. |
| Cmd/Ctrl + Left Arrow | Move to the first cell of the current row. |
| Cmd/Ctrl + Right Arrow | Move to the last cell of the current row. |
| Cmd/Ctrl + Up Arrow | Move to the first row of the current column. |
| Cmd/Ctrl + Down Arrow | Move to the last row of the current column. |
| Tab | Move to the next cell; wraps to the next row if at the end. |
| Shift + Tab | Move to the previous cell; wraps to the previous row if at the beginning. |
When a cell is selected (not in editing mode)
| Shortcut | Action |
|---|---|
| Enter | Enter editing mode for the selected cell. |
| Cmd/Ctrl + C | Copy the text in the cell. |
| Cmd/Ctrl + V | Paste text into the cell. |
| Delete | Delete the content of the cell. |
| Shift + Arrow Keys | Select multiple cells. |
When a cell is in editing mode
| Shortcut | Action |
|---|---|
| Enter | Save the content and exit editing mode. |
| Esc | Cancel editing and revert to the original content. |
Tips for Efficient Editing
- Selecting Multiple Cells: Hold down the Shift key while using the arrow keys to select multiple cells.
- Pasting into Multiple Cells: After selecting multiple cells, you can paste a single value into all of them simultaneously.
Video Tutorials:
Part 1:
Part 2:
Using Keyboard Shortcuts
Updated about 1 year ago