
Usage
Overview:
This section will help you monitor your document and page usage over different time periods and view usage metrics in various formats. You can track your usage in the current billing cycle, last billing cycle, or any custom date range. You can also see results at different cadence: daily, weekly, or monthly.
Steps to Check Usage:
-
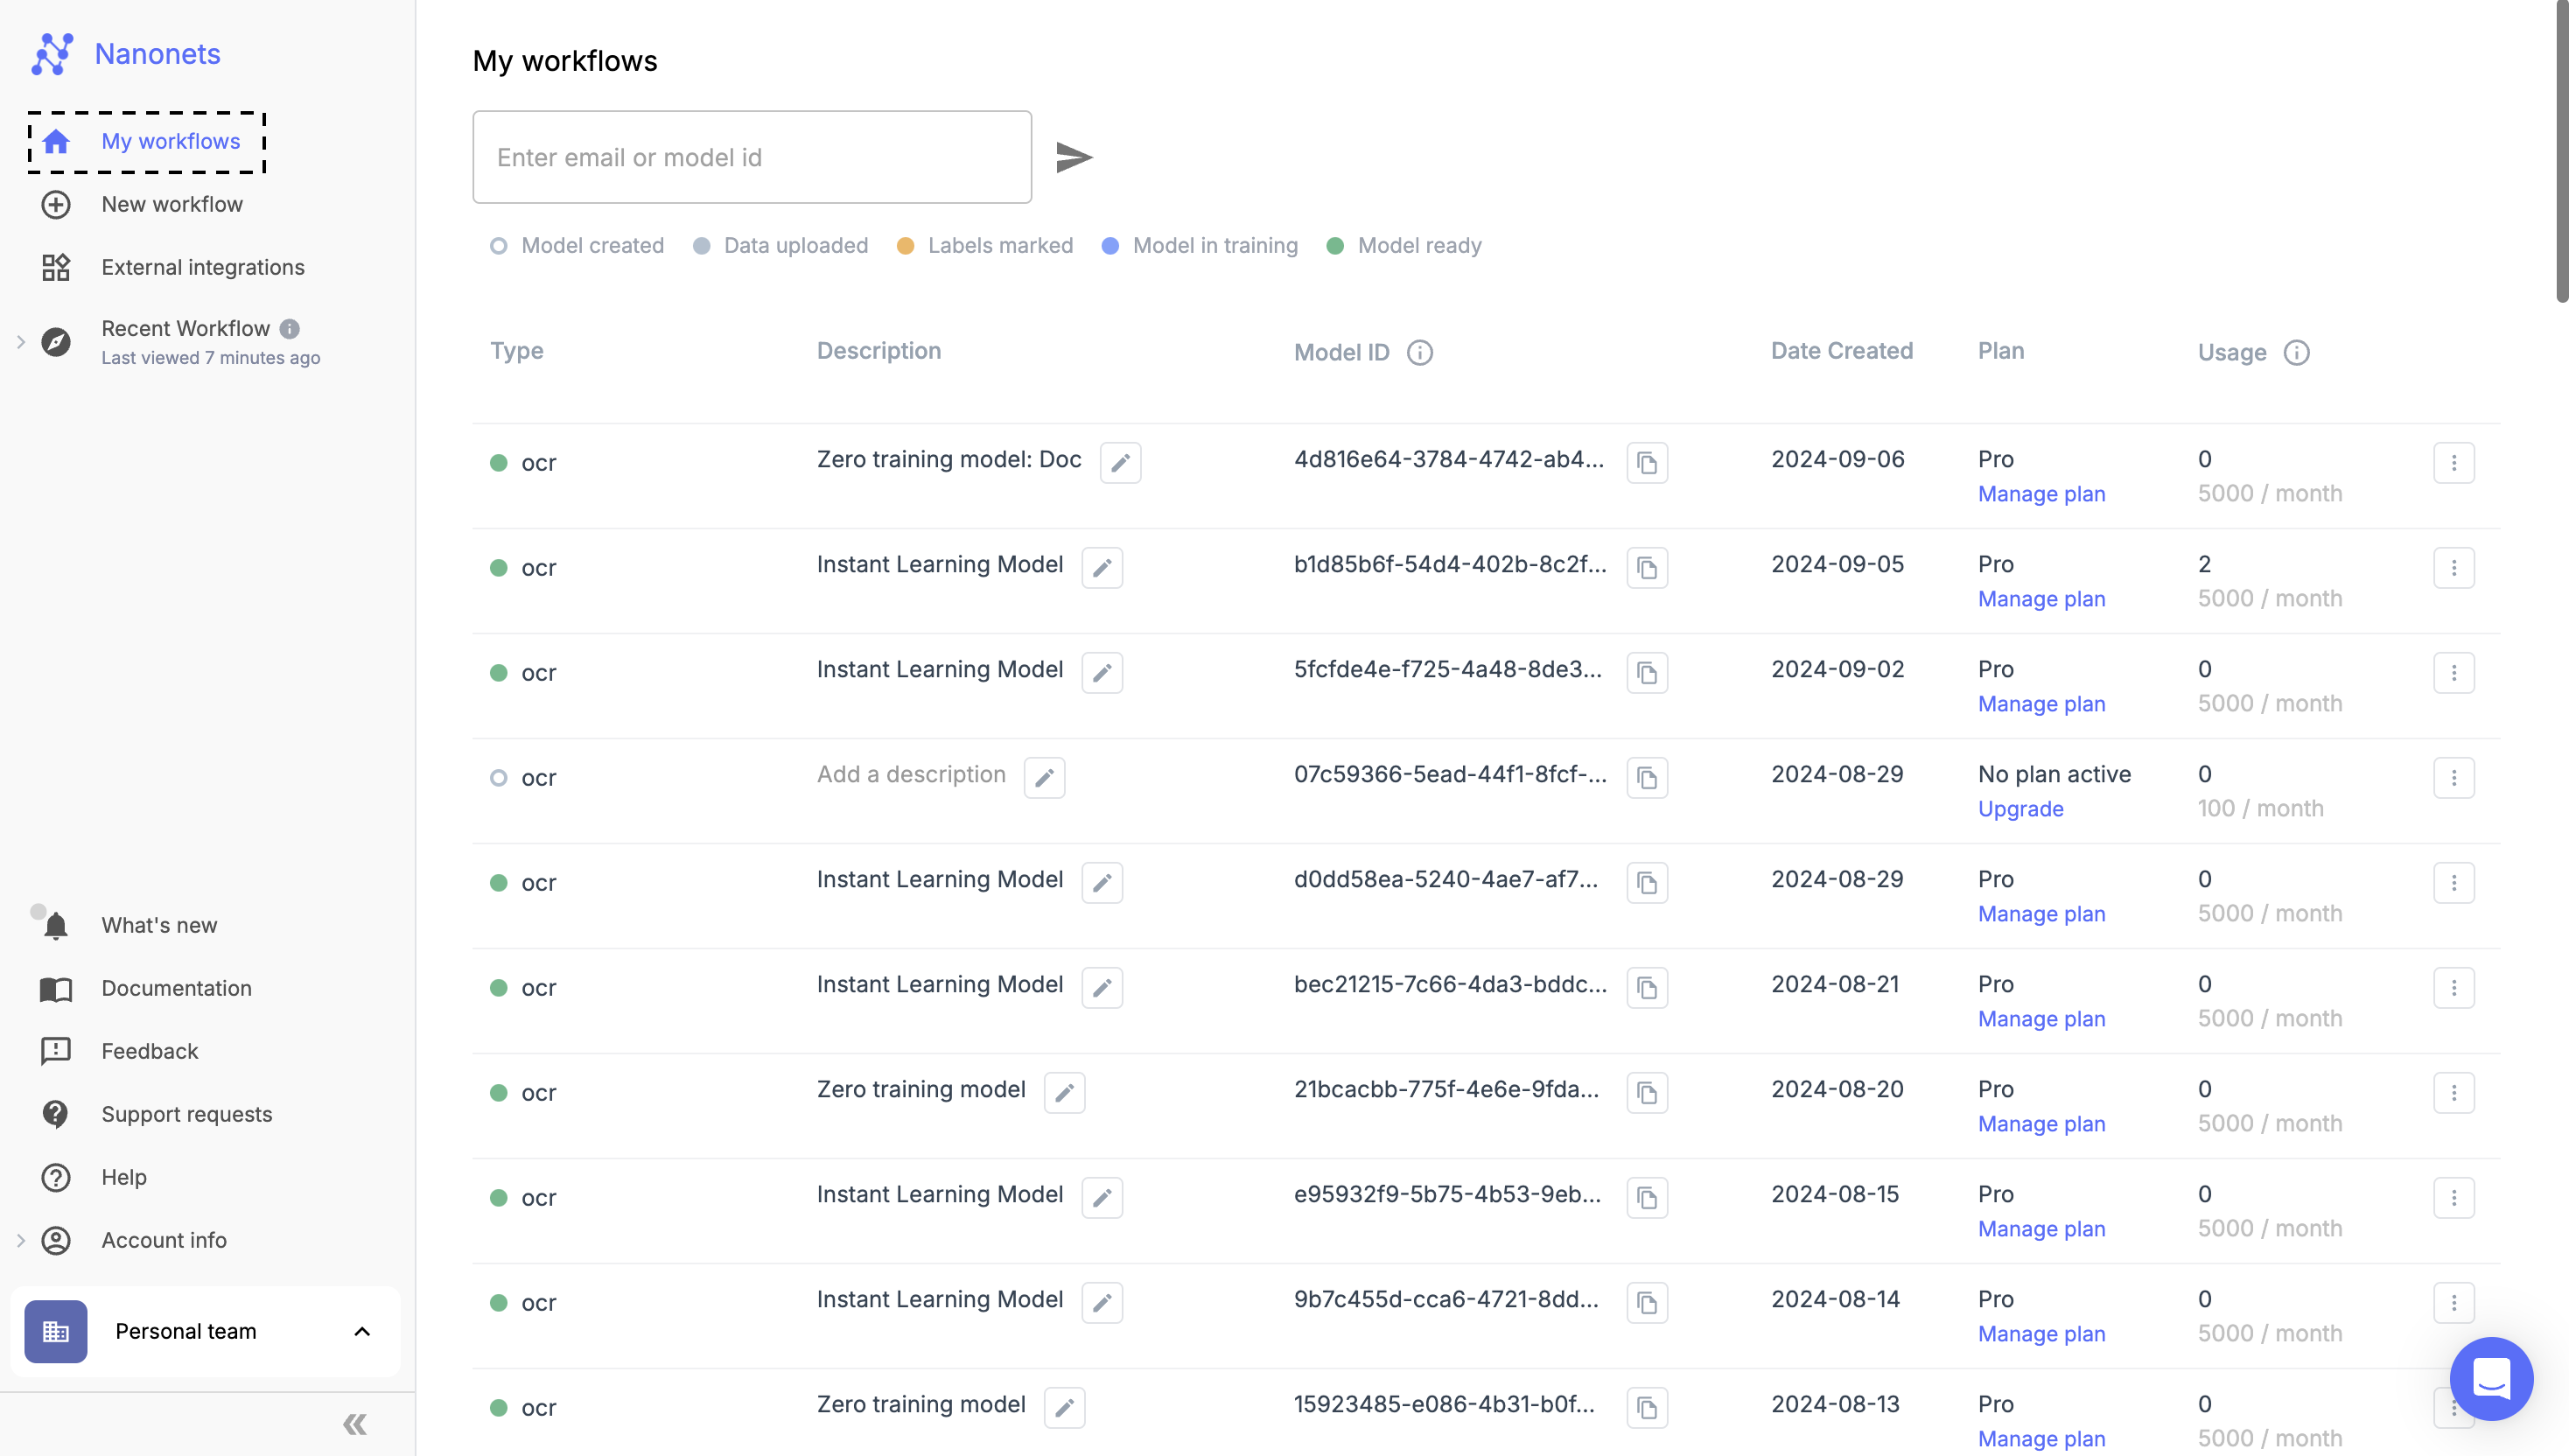
Navigate to My Workflow:
- Log in to your Nanonets account.
- From the dashboard, go to the "My Workflow" section on the left-hand navigation bar.
-
Select the Model:
- Choose the specific model for which you want to view usage from the list of available models.
-
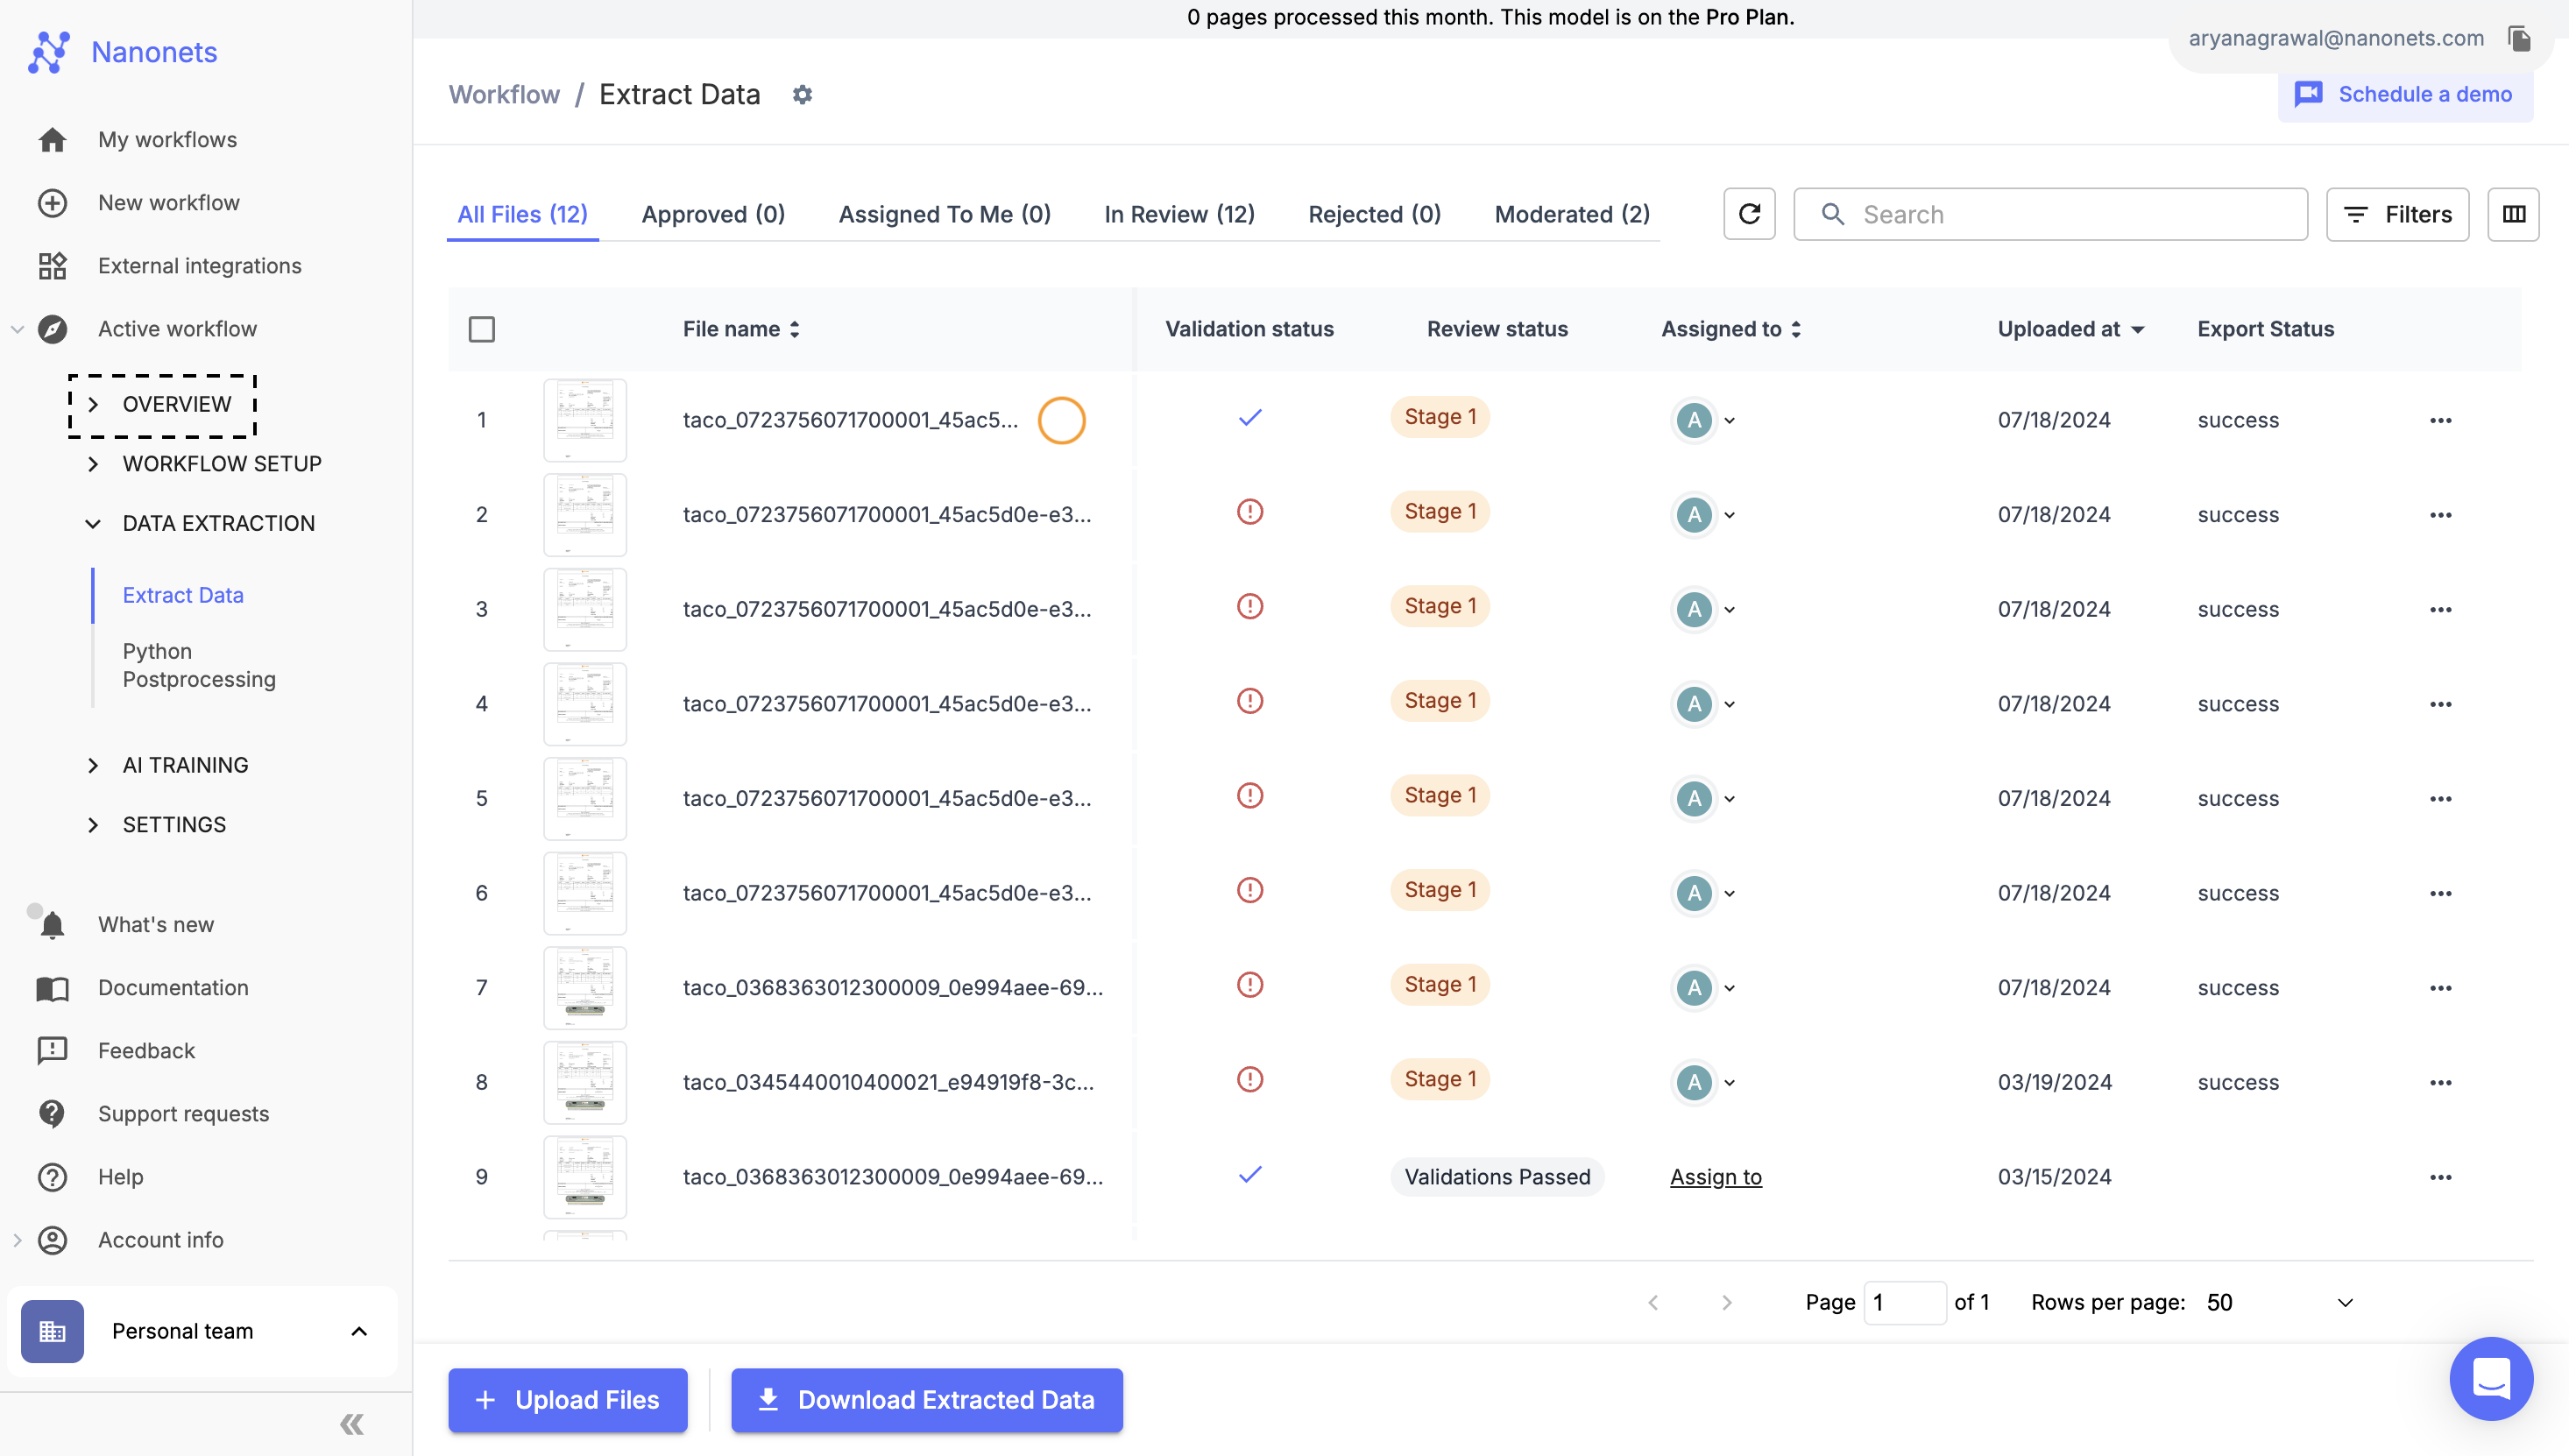
Open Usage Stats:
- After selecting the model, navigate to the Extract Data screen.
- On the left-hand side, under the Overview section, click on Usage Stats.
-
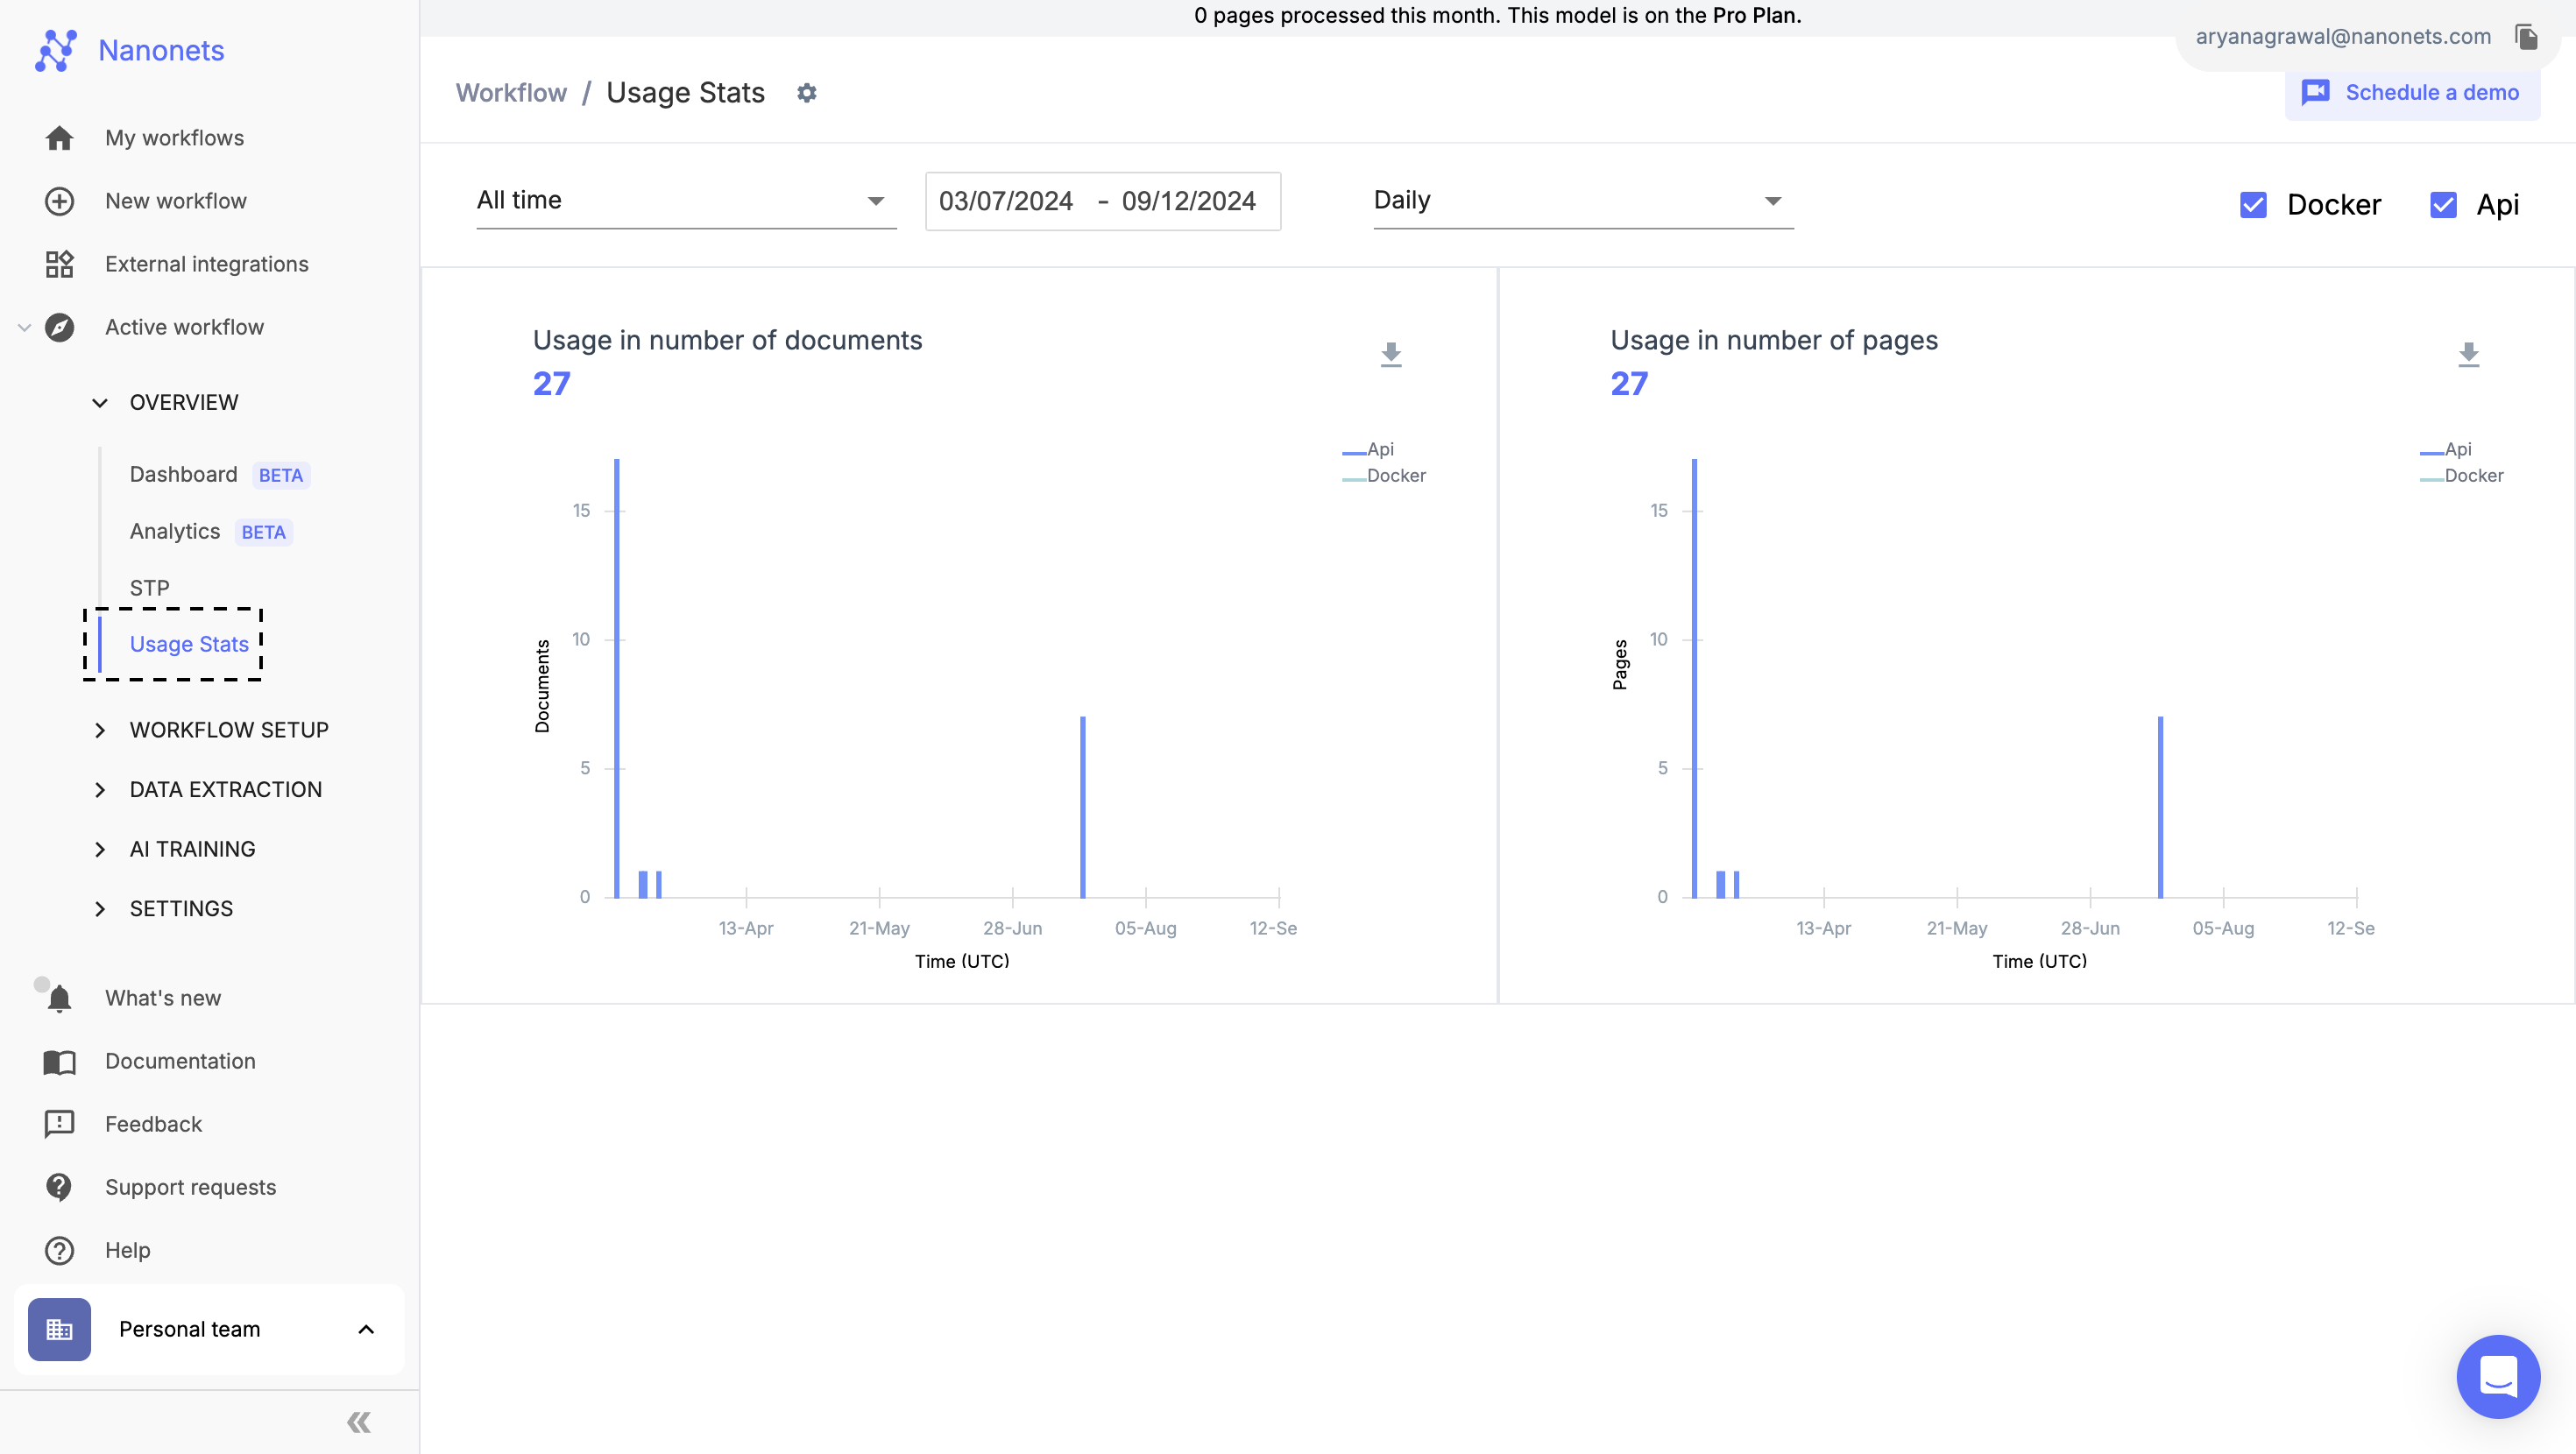
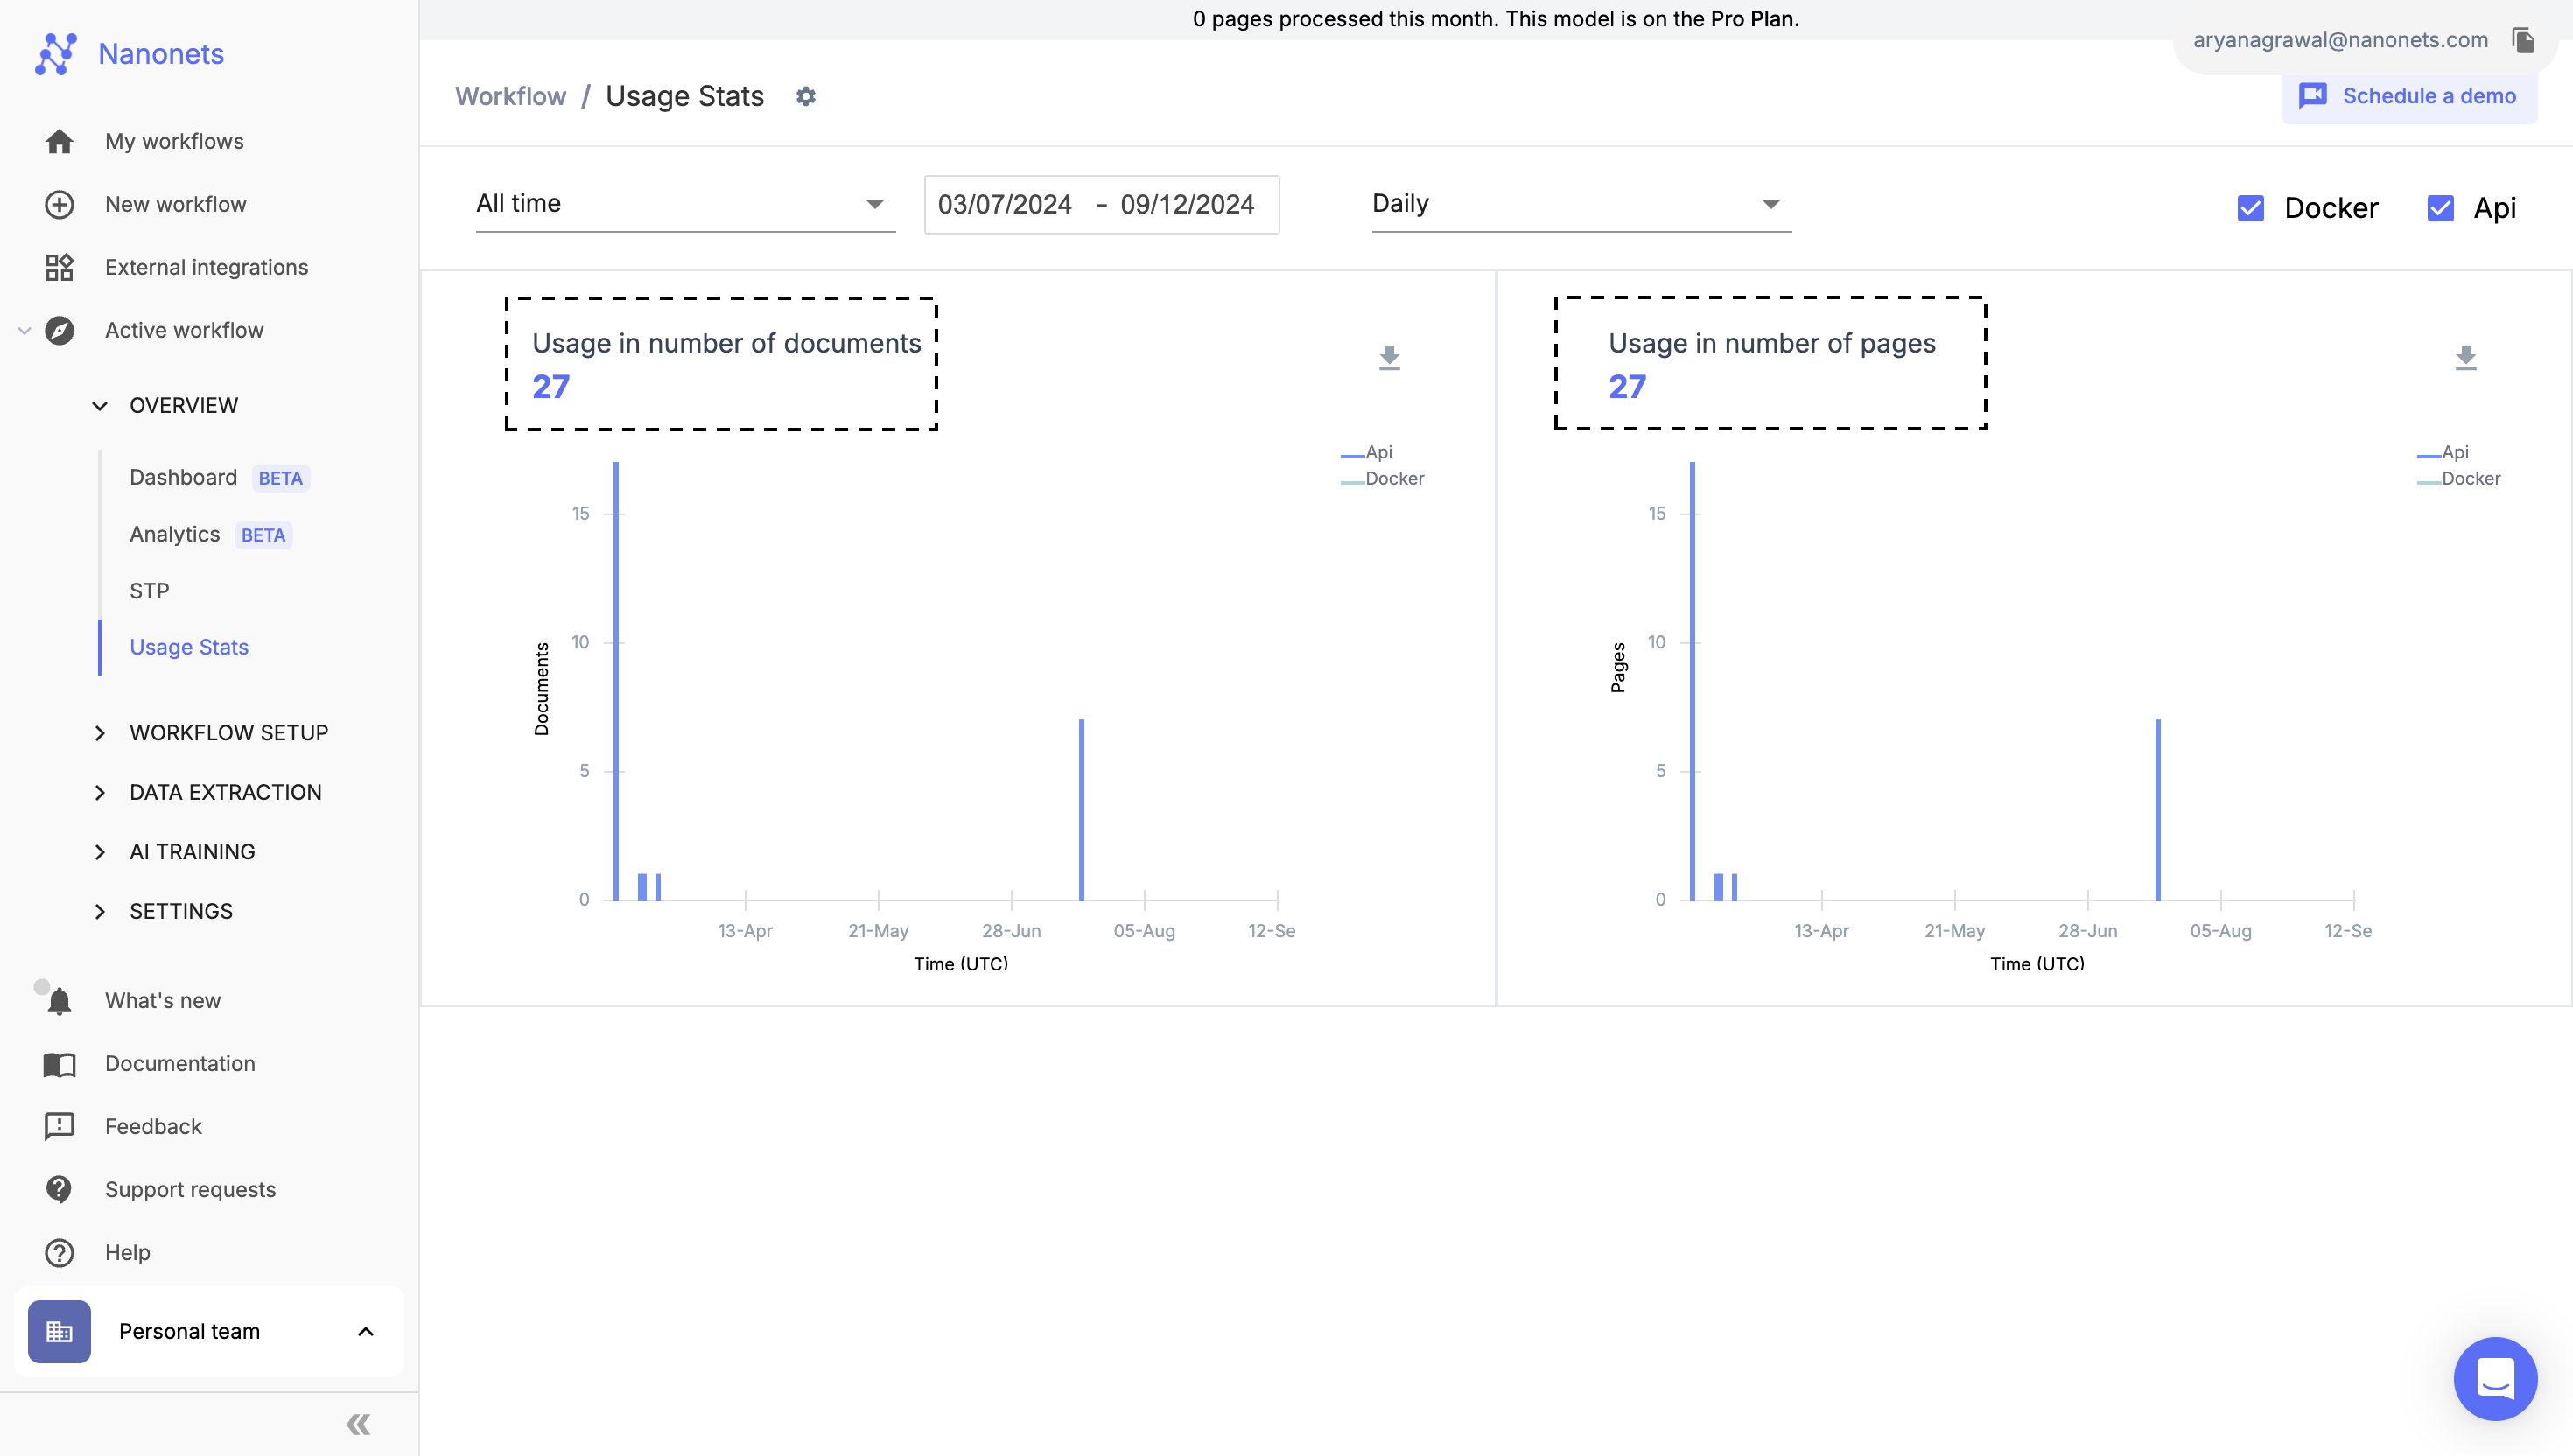
View Usage Metrics:
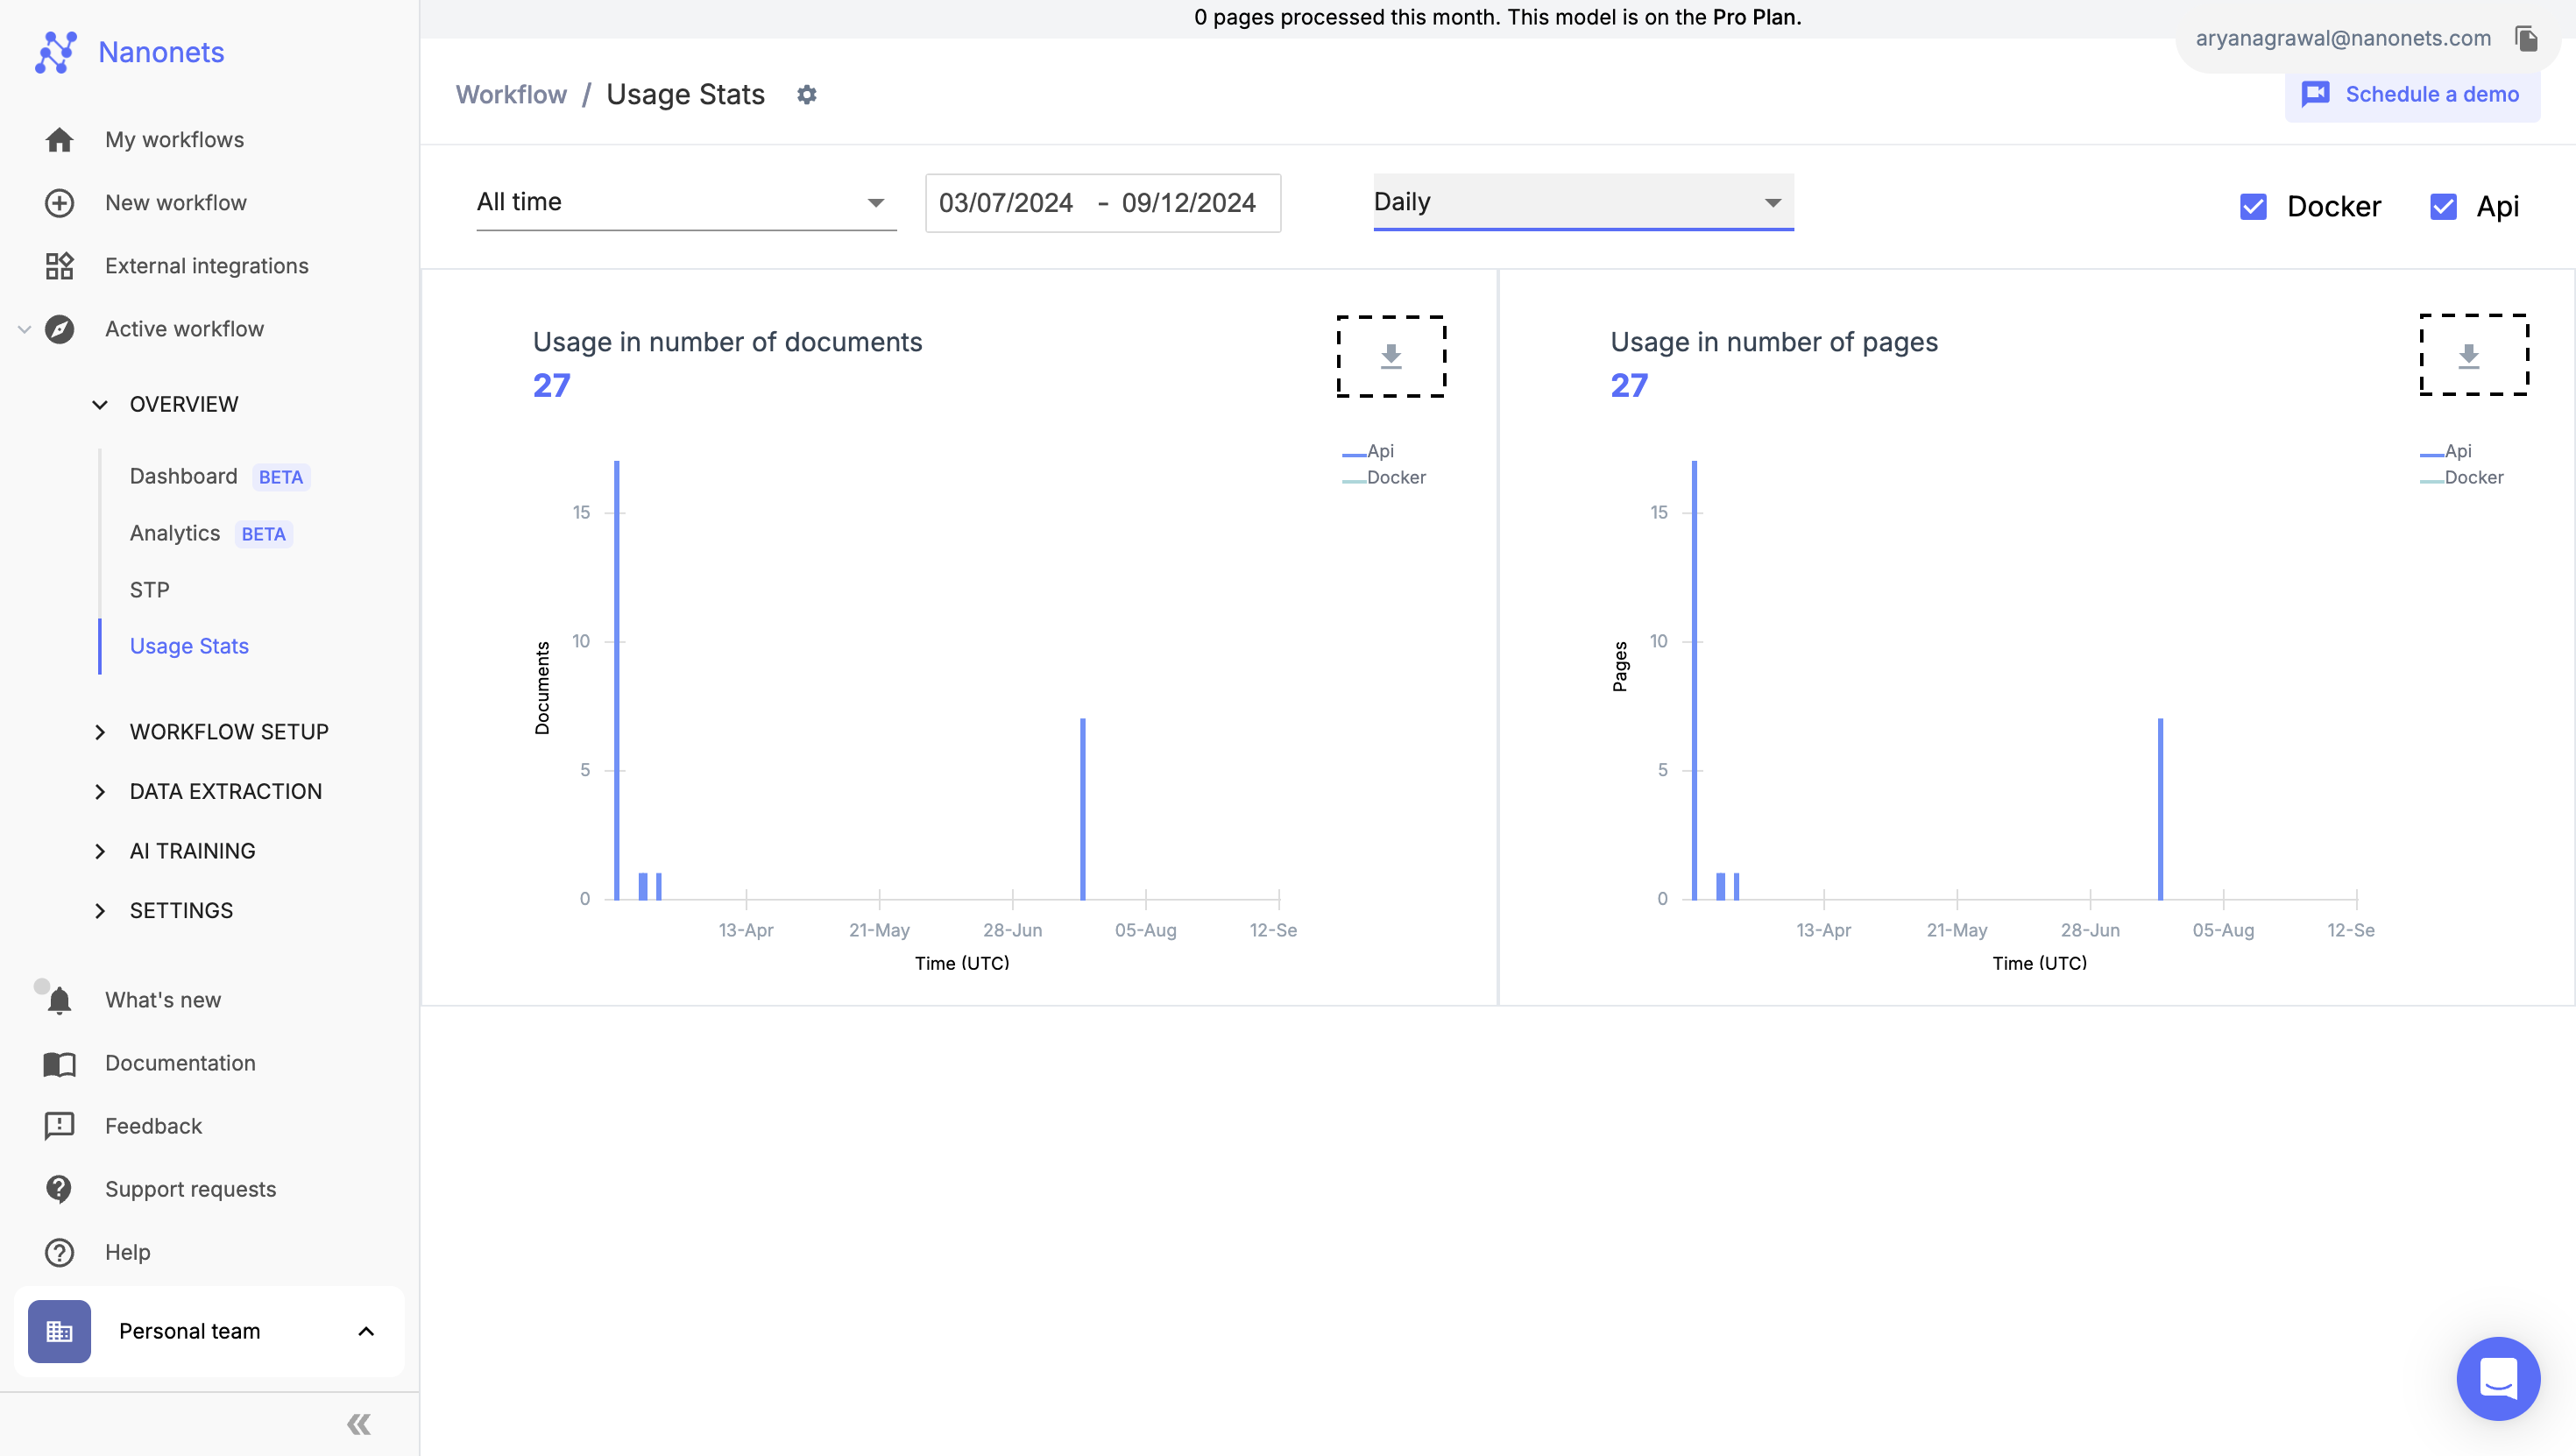
- On the Usage Stats page, you will see two primary graphs:
- Usage in Number of Documents
- Usage in Number of Pages
- These graphs show the usage trend over time, broken down by document and page counts, for the selected model.
- On the Usage Stats page, you will see two primary graphs:
-
Customize Your View:
-
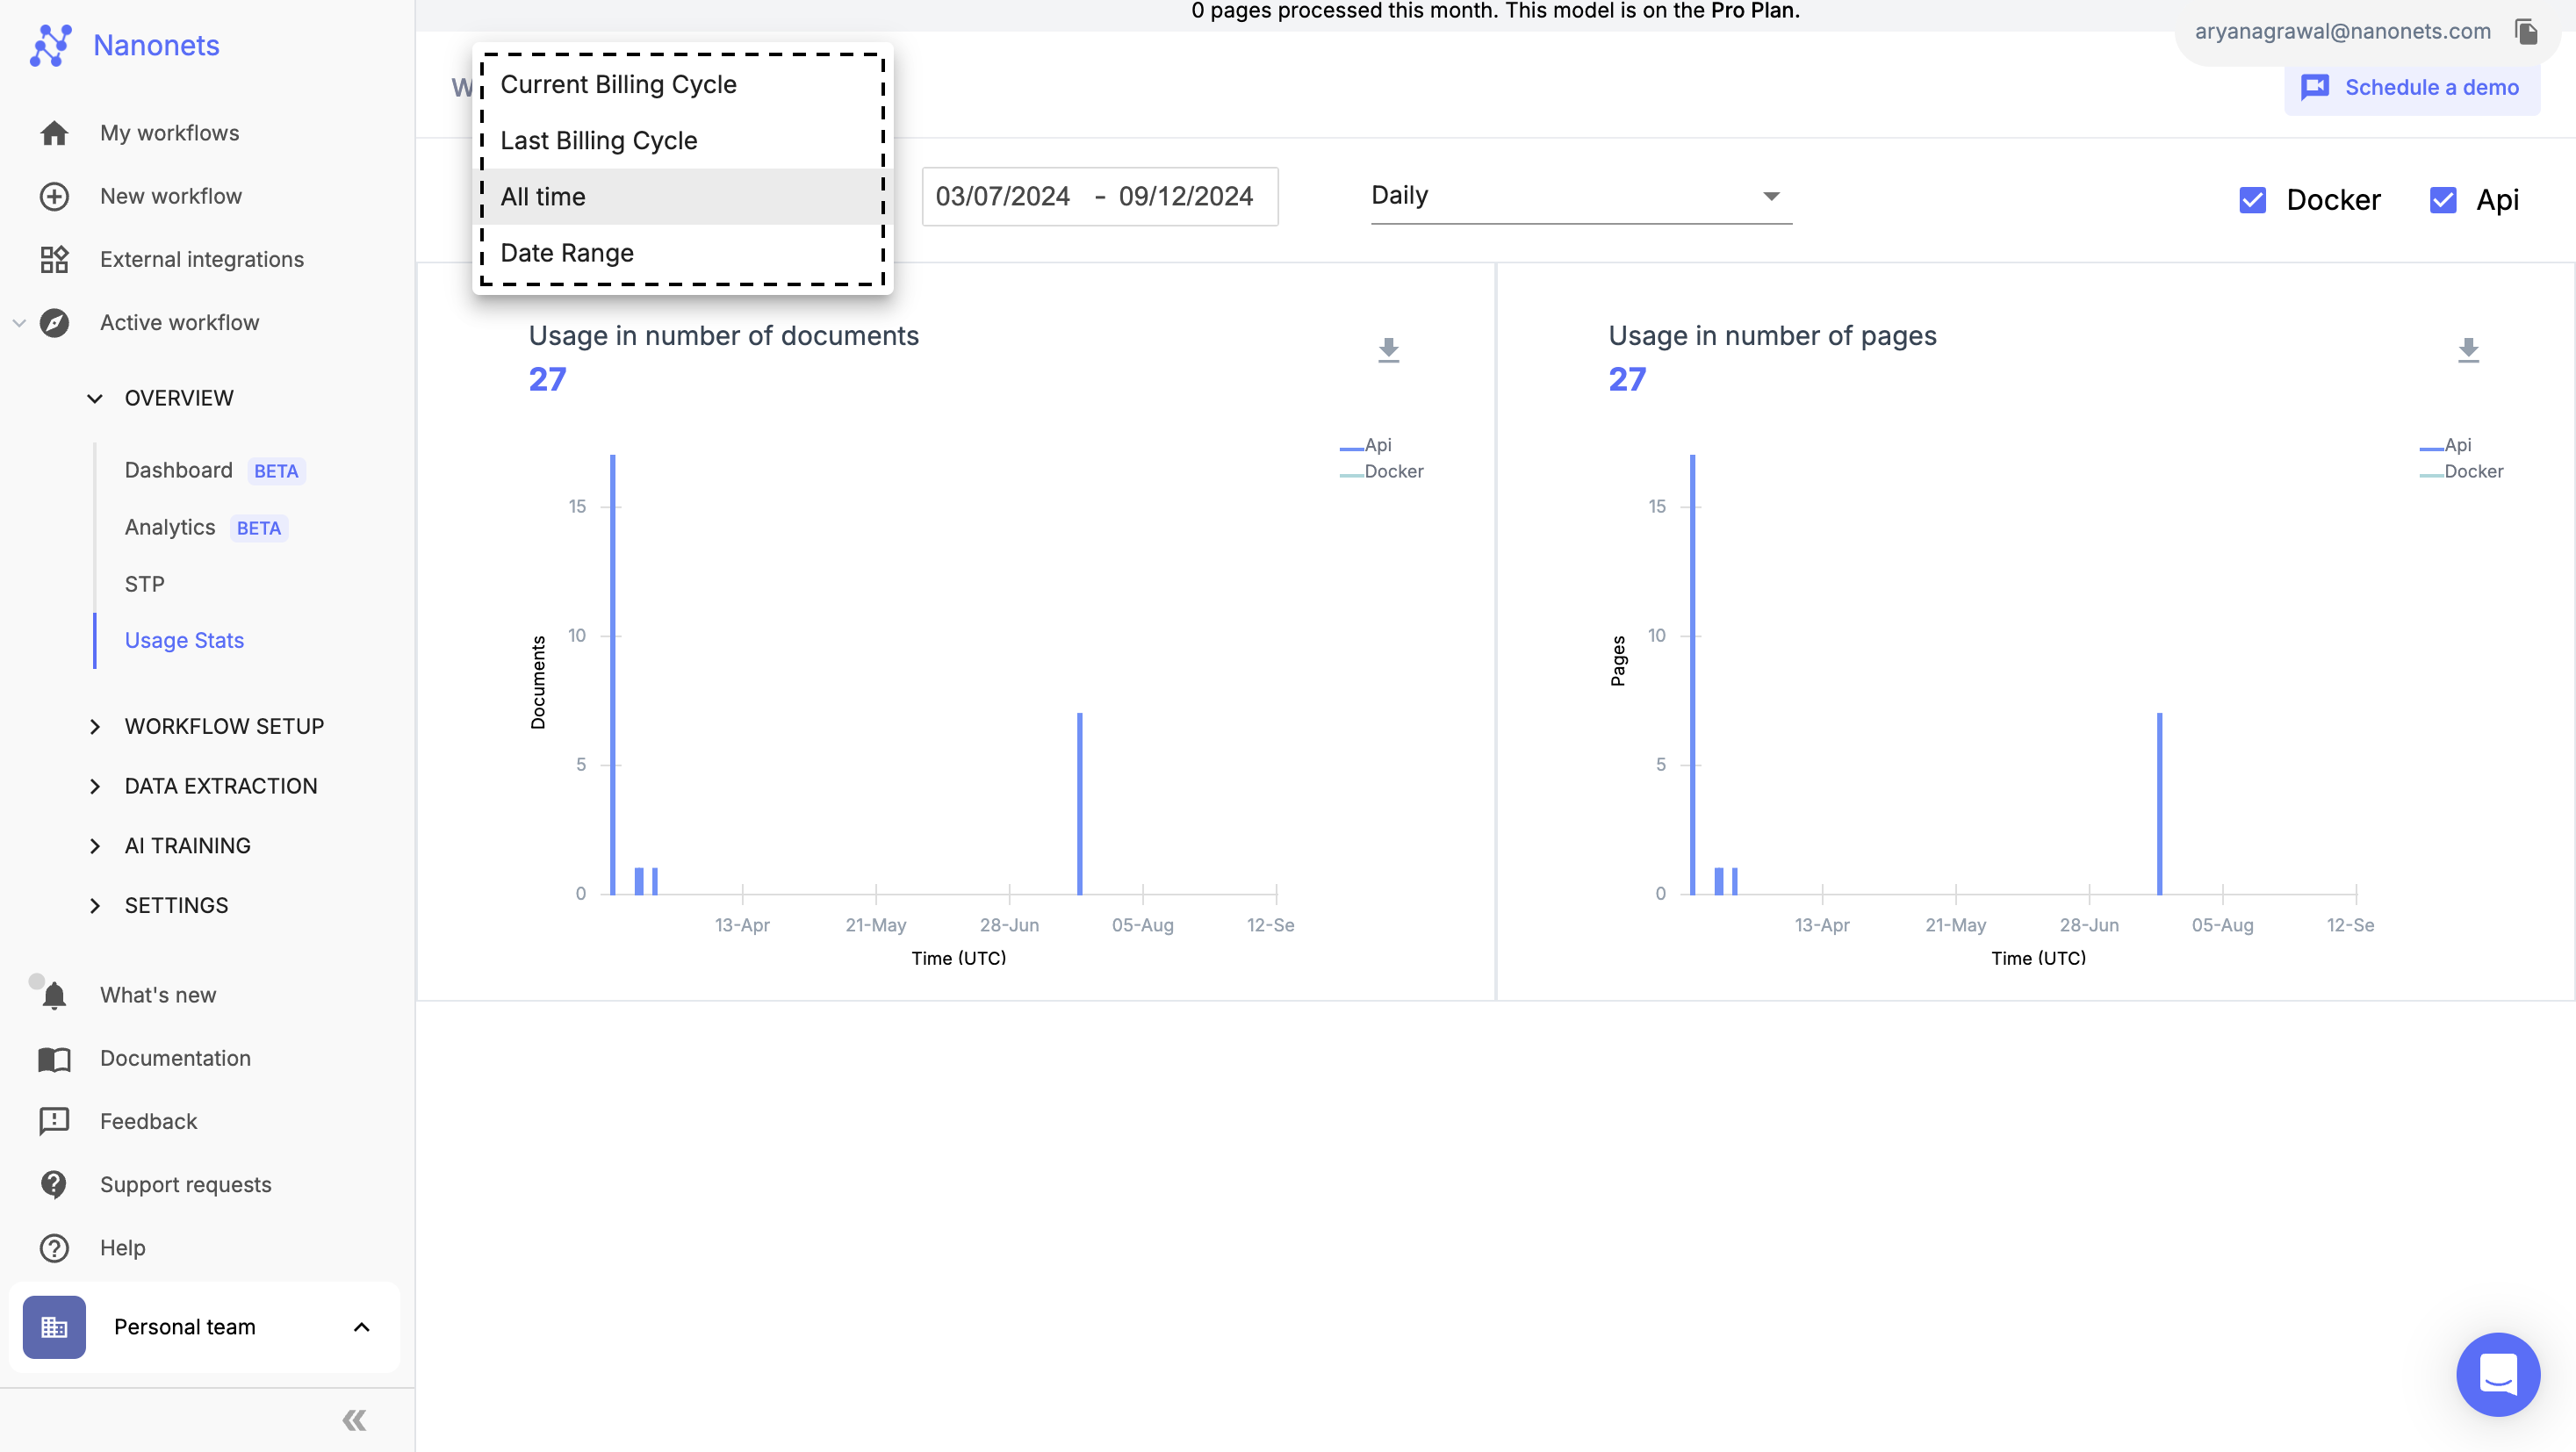
Date Filter: Adjust the date range using the filters at the top. You can view data for:
- All Time: View usage data from the beginning.
- Current Billing Cycle: See usage for the ongoing billing period.
- Last Billing Cycle: View data from the previous billing period.
- Custom Date Range: Select a specific date range to narrow down the usage data.
-
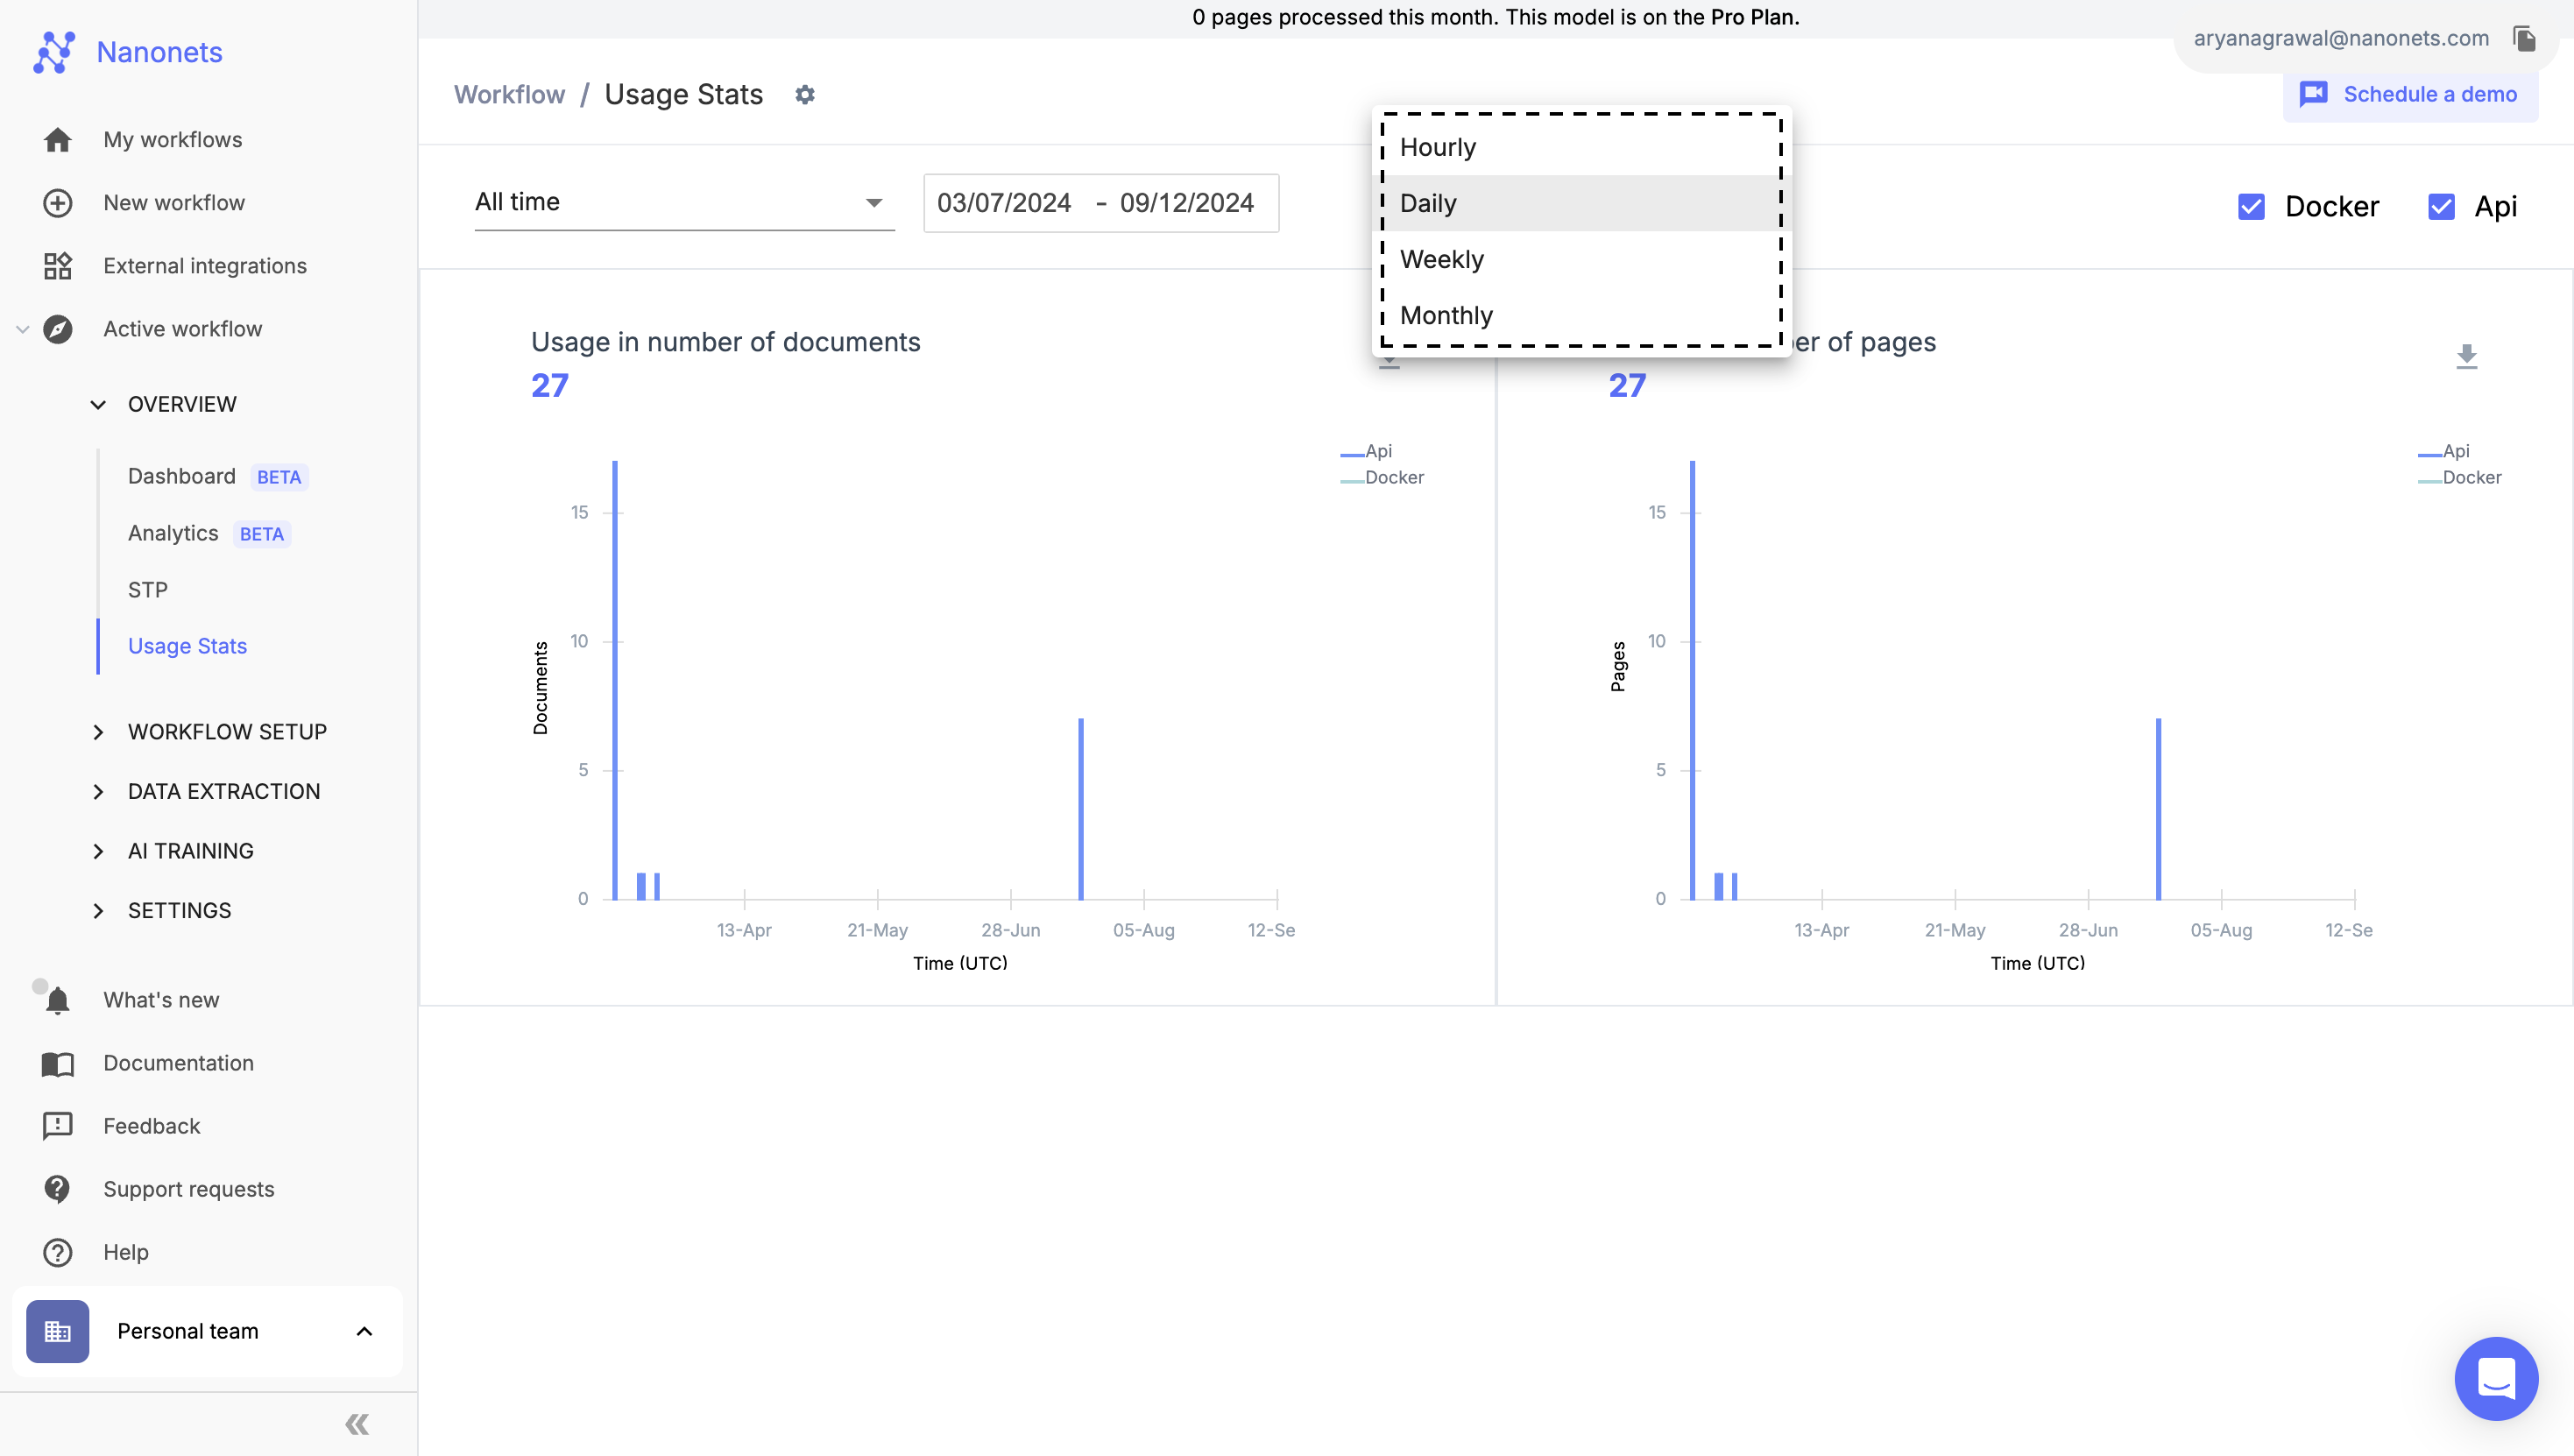
Cadence Filter: Choose how you'd like to view the data:
- HourlyTrack usage in hourly increments.
- Daily See the daily breakdown of your usage.
- Weekly Monitor usage on a week-by-week basis.
- Monthly Review a monthly summary of your document and page usage.
-
-
Export Data:
- You can download the data represented by the graphs using the download icon beside the graph.
Use the steps above to check your usage. If you still face any issues, please reach out to us at [email protected] or [email protected]
Updated about 1 year ago
Did this page help you?